Data shows the state’s ski areas’ season snow totals trending downward over last 60 years
Colorado’s ski areas experienced a tough winter 2025/26 as recorded snowfall totals from opening days in October and November to early closings in mid-march to early May were significantly down.
Every ski area or resort recorded snowfall totals below- to- well-below their historical averages, and according to recent data, those historical averages are shrinking.
Looking at snowfall records from two Front Range ski areas and one SNOTEL site near one southwestern Colorado ski area paint a disheartening picture. Ski areas, overall, are drier and are receiving less annual snowfall on average over the last 60 years.

First off, winter 2025/26 will be an outlier season because a majority of Colorado ski areas or resorts closed early due to a lack of snow.
‘Official’ measurements, or measurements useful to skiers and riders utilizing the slopes via chairlift, were cut short even though late-season snow fell very late season from mid-April to early May.
Recorded or *estimated snowfall totals from Colorado ski areas during their operating season:
- Arapahoe Basin – Season total: 175″ – Average: 308″, 57% of average
- Aspen Highlands* – Season total: 144″ – Average: 260″, 55% of average
- Aspen Mountain* – Season total: 155″ – Average: 249″, 59% of average
- Beaver Creek – Season total: 126″ – Average: 323″, 39% of average
- Breckenridge – Season total: 155″ – Average: 283″, 54% of average
- Buttermilk* – Season total 105″ – Average: 200″, 52% of average
- Crested Butte – Season total: 143″ – Average: 253″, 56% of average
- Cooper* – Season total: 91″ – Average: 180″, 50% of average
- Copper Mountain – Season total: 179″ – Average: 278″, 64% of average
- Echo Mountain* – Season total: 50″ – Average: 56″, 89% of average
- Eldora – Season total: 131″ – Average: 225″, 59% of average
- Granby Ranch* – Season total: 38″ – Average: 85″, 44% of average
- Howelsen Hill* – Season total: 30″ – Average: 85″, 35% of average
- Kendall* – Season total: 80″ – Average: 200″, 40% of average
- Keystone – Season total: 140″ – Average: 238″, 58% of average
- Loveland – Season total: 176″ – Average: 337″, 52% of average
- Monarch – Season total: 112″ – Average: 282″, 39% of average
- Powderhorn – Season total: 90″ – Average: 160″, 56% of average
- Purgatory – Season total: 104″ – Average: 261″, 39% of average
- Silverton* – Season total: 150″ – Average: 380″, 39% of average
- Snowmass* – Season total: 183″ – Average: 301″, 60% of average
- Steamboat – Season total: 169″ – Average: 370″, 45% of average
- Sunlight – Season total: 85″ – Average: 222″, 38% of average
- Telluride – Season total: 122″ – Average: 276″, 44% of average
- Vail – Season total: 168″ – Average: 352″, 47% of average
- Winter Park – Season total: 197″ – Average: 349″, 56% of average
- Wolf Creek – Season total: 192″ – Average: 385, 49% of average
- * estimated snowfall
- Data: Averages from OnTheSnow from 2012/13-2025/26, Snowfall: Season totals from ski area websites and OnTheSnow.
Digging into the data
Data collected at two ski resorts and one NRCS SNOTEL site near another show seasonal snowfall totals have been declining respectively over the last ~60 years.
Loveland Ski Area in Clear Creek County has its seasonal snowfall totals posted online dating back to winter 1968/69; 58 seasons worth of data when counting winter 2025/26.
Over the course of those 58 seasons, the ski area’s average annual snowfall totals are showing an overall downward trend, one which shows the ski area has been losing -0.86 inches of snow per season.

Loveland’s average snowfall across the 58 seasons on record is approximately 391″ of snow; one of the top five snowiest resorts in Colorado.
But the average rate of snowfall decline over the 58-season span is 49.88″ of snow, meaning Loveland is trending approximately 50″ of snow drier in the most recent winter (25/26) compared to the first winter of record in 68/69.
High variabilities within the data are apparent too, with big swings of 200–300″ of snow between neighboring seasons, making the underlying trend harder to see without the regression line.
A similar story at Copper Mountain in Summit County has unfolded with an even larger average rate of decline in season snowfall totals, and within in a shorter time period too.
Copper Mountain’s average decline rate is around -2.51 inches per season, which is over three times greater than Loveland’s average decline rate.

Copper Mountain’s public-viewable period of record only goes back to winter 2005/06, with older records used internally for reference, according to Copper Mountain Resort.
Copper Mountain began recording season snowfall totals at the Cache site near the Aerie in November 2003. The resort added October snowfall totals to their season totals during the 2013/14 season, then added May snowfall totals during the 2022/23 season.
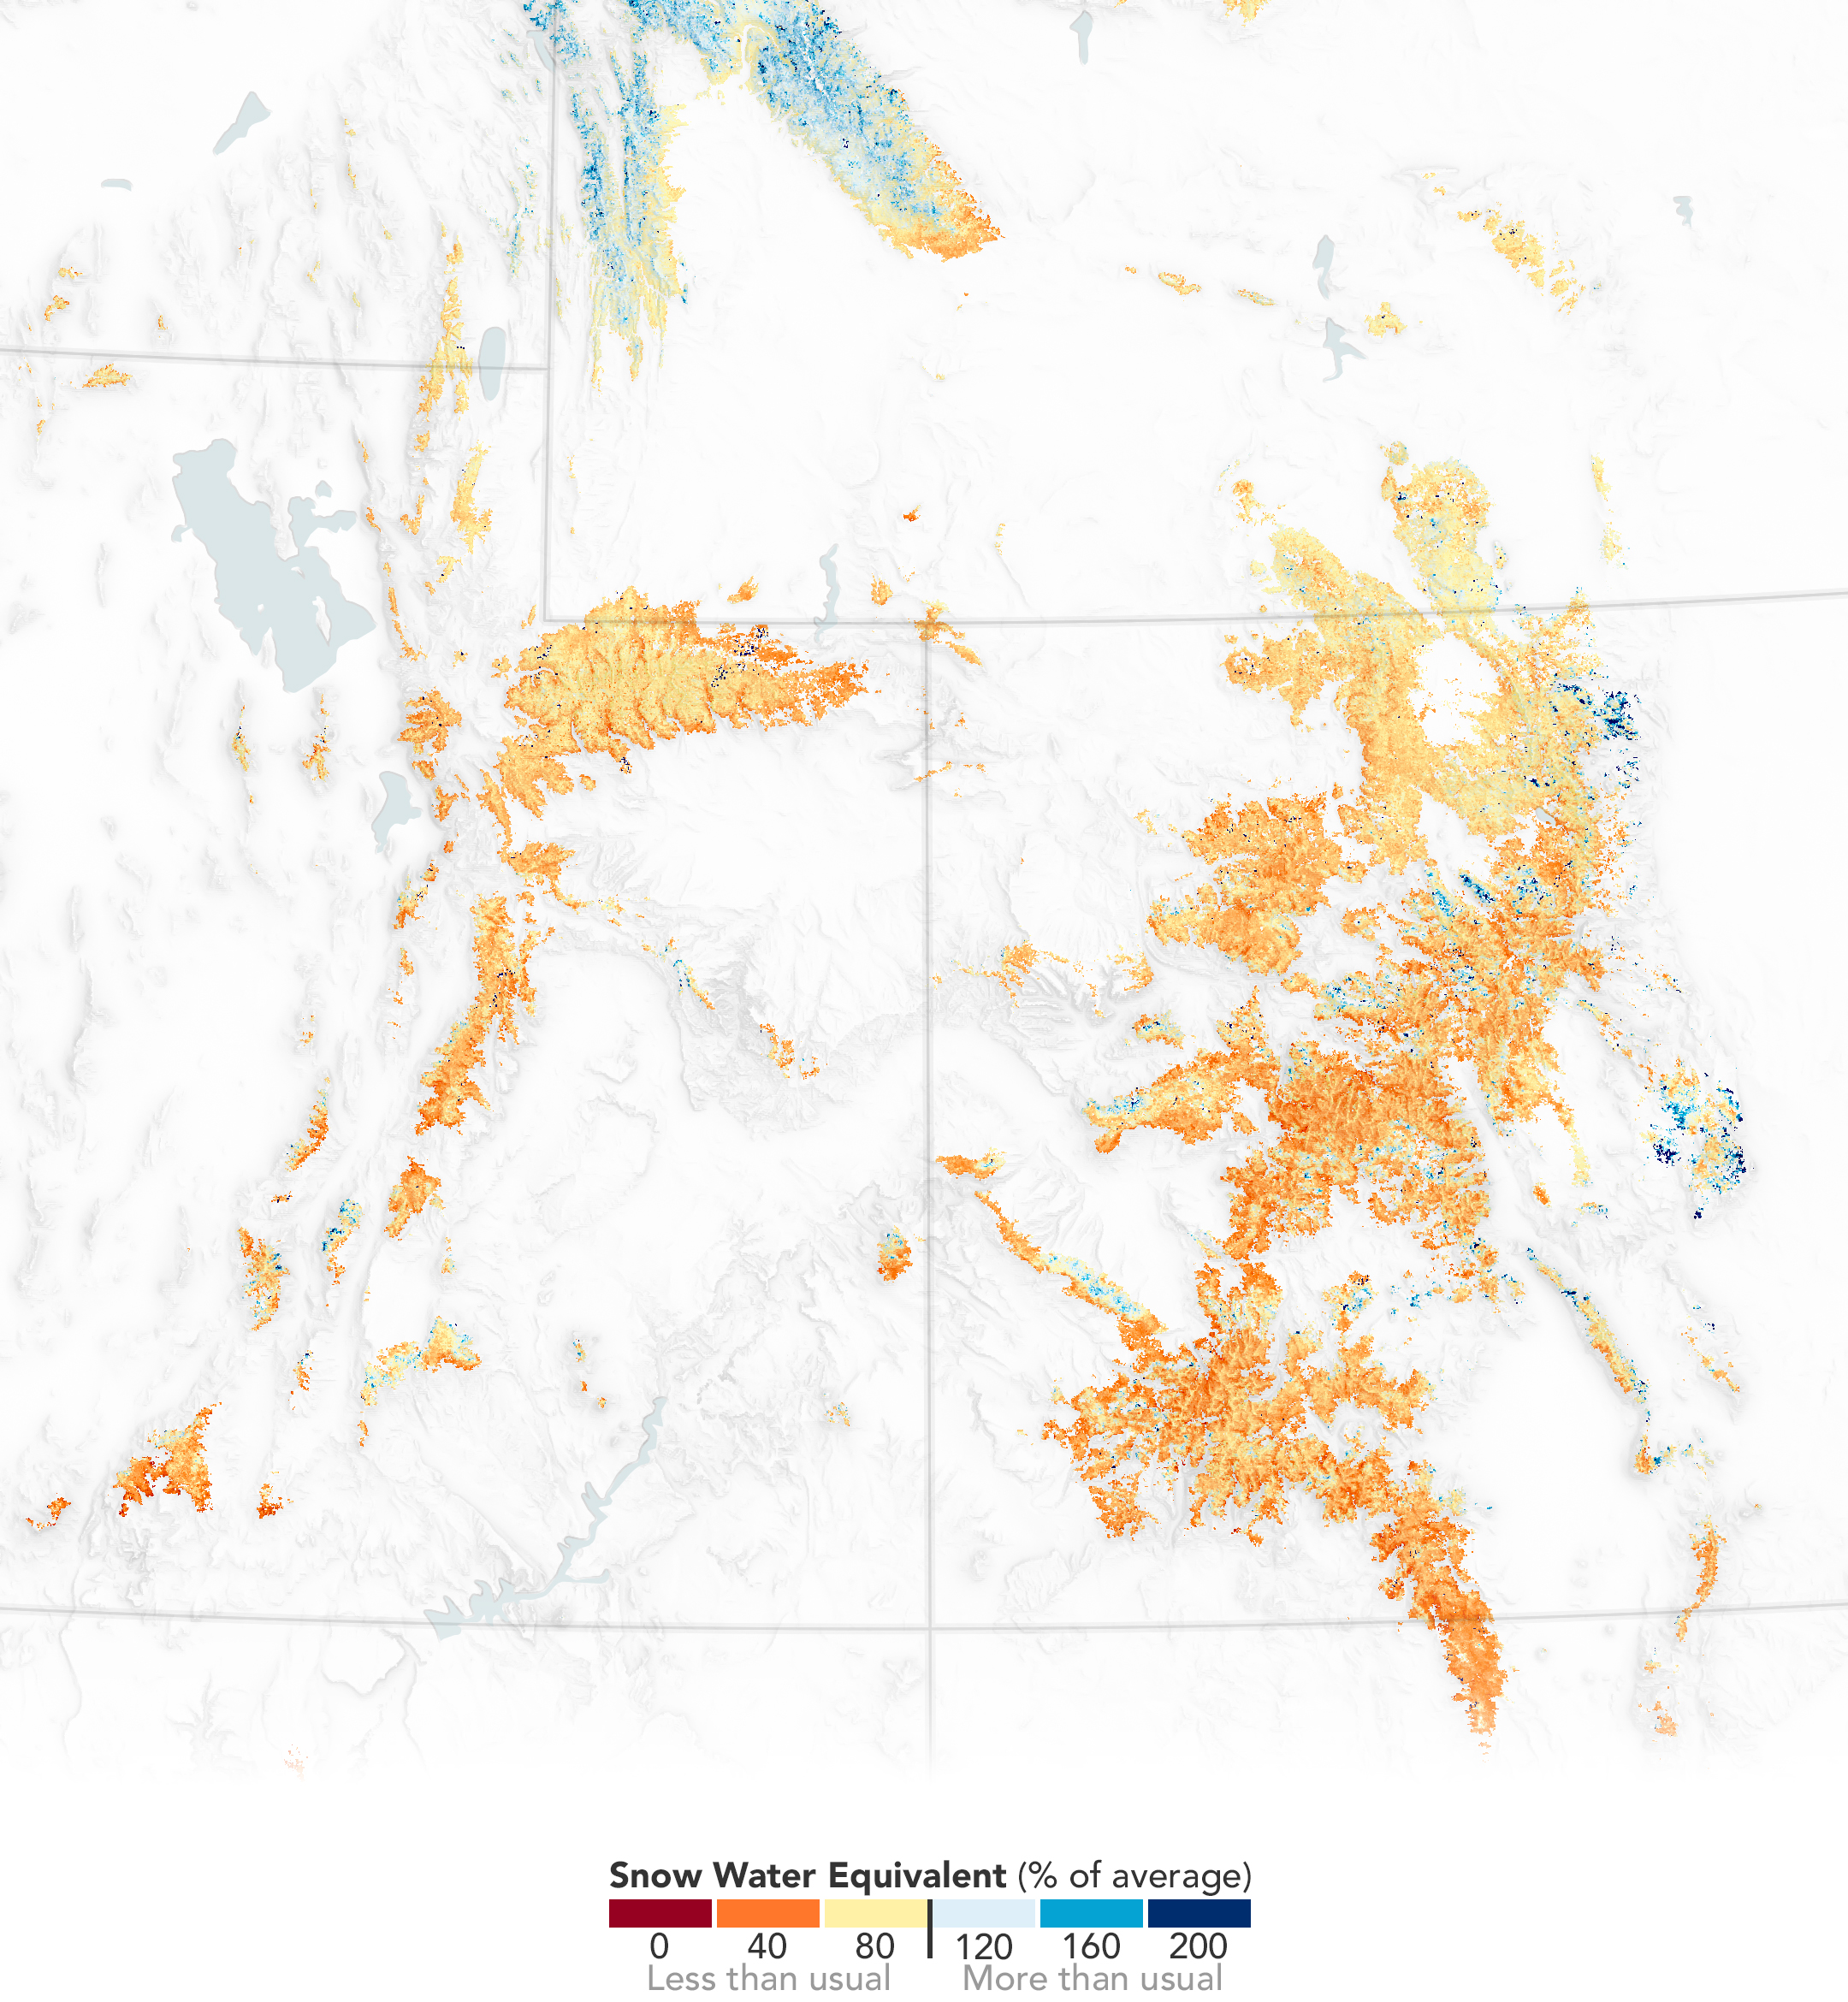
At the Cascade #2 SNOTEL automated weather station about two miles north of Purgatory Mountain Resort in southwestern Colorado, declines in season-to-season snow water equivalent (SWE) average percentages have been in decline as well.
Using SWE measurements from October to May starting in winter 1990/91 through winter 2025/26, decadal blocks show a mixed message, with two decades of decline in average SWE and two decades of increase in SWE.
However, over the 36-year period of record, SWE recorded at Cascade #2 is trending in decline at approximately -0.165%/month, a modest drop overall but a signal potential longer-term SWE loss could continue.
SWE percent of average and trends across each decadal period at Cascade #2:

- 1990s — Declined (-0.159%/month): The decade begins with average years from winter 1990/91 through winter 1993/94, then declines in the mid-90s overall, with a wild spike during winter 1996/97 being the anomaly of the decade, before another 3-year decline to close out the decade.

- 2000s — Increased (+0.673%/month): The 2000s saw the strongest upward trend of the four decades, driven by big SWE years in winter 2004/05 and winter 2007/08.

- 2010s — Slightly Increased (+0.073%/month): The 2010’s were essentially flat, with a very gentle rise over the decade, bookended by a wet winter 2010/11 and strong finish in winter 2018/19.

- 2020s — Declined (-0.703%/month): The 2020s have seen the steepest decline of any decade, particularly in winter 2025/26, creating a more dramatic loss over the 6-year period.
Snow water equivalent and snowfall totals are related, however, they are not truly the same thing.
SWE measures how much water is locked in the snowpack at a given moment in the season, while snowfall measures total accumulation over a winter.
Three reasons why SWE and snowfall totals don’t convert cleanly:
- Cascade #2 measures the snowpack that persists, not every storm that comes and goes
- Snow density varies widely; a wet, heavy snow has far more SWE per inch than a light, powder snow
- SWE is a snapshot measurement, snowfall is a cumulative measurement
Because Cascade #2’s elevation is at 8,990′ and Purgatory’s base elevation is 8,793′, it is more than likely snowfall totals are similar from season-to-season at each site respectively.
Purgatory Mountain’s seasonal snowfall average over the past 14 seasons is 210″, according to data from OnTheSnow, however, Purgatory’s historic average since its opening year in winter 1965/66 is 261″, according to Purgatory’s website.
When comparing both datasets, they each point in the same direction — less water in the snowpack, less snow on the ground.
The Purgatory snowfall data shows a 51″ drop from historic averages over the past 14 years, which is a decline of roughly 19.5% from the long-term norm over the 61-year period.
When combined with Cascade #2’s declining SWE trend, two independent datasets corroborate the same regional story: the San Juan Mountains are getting drier winters.
For context, the 51″ snow deficit at Purgatory is comparable to Loveland’s 50″ snow deficit over approximately the same 60-year time period.
Skiers visits down sharply due to lack of snow
Preliminary data released Tuesday, May 5 from the National Ski Areas Association (NSAA) indicated that winter 2025/26 saw an estimated 52.6 million snowsports visits at U.S. ski areas.
According to NSAA, this number represents a 9.1% decrease from the 10-year average, a decline of approximately 9 million visits from last season, and ranked 32nd out of 48 seasons on record.
“Few seasons demonstrate as clearly as this one how dependent our industry remains on regional weather patterns,” NSAA President and CEO Michael Reitzell said. “Challenging conditions across much of the West — including a slow start, rain events, and record March warmth — significantly impacted visitation throughout the season.”
According to NSAA, snowfall trends have long influenced visitation, with the 2025/26 season being no exception.
Average snowfall nationally totaled 112 inches, falling well below the 10-year average of 169 inches and the lowest in more than a decade.
“While regions east of the Rockies were near or above average, every Western region fell well below average,” NSAA said.
There’s always next season
The World Meteorological Organization (WMO) announced on April 24 its forecast for an El Niño or strong El Niño event in 2026/27, likely forming as early as May-July (61% chance).
An El Niño event is characterized by a warming of ocean surface temperatures in the central and eastern Equatorial Pacific, the WMO said, with the event typically occurring every two to seven years and can last between 9-12 months.

“After a period of neutral conditions at the start of the year, climate models are now strongly aligned, and there is high confidence in the onset of El Niño, followed by further intensification in the months that follow,” Wilfran Moufouma Okia, Chief of Climate Prediction at WMO said.
According to the WMO, El Niño events affect temperature and rainfall patterns in different regions and typically have a warming effect on the global climate.
In Colorado, El Niño events typically bring wetter-than-average conditions to southern Colorado with higher snowpacks in the southern and south central mountains. El Niño events typically bring drier-than-average conditions to northern Colorado with lower snowpacks in the north central, northwestern and northern mountains.
However, strong El Niño events, similar to the one forecast for winter 2026/27, can bring heavy snowfall events to the eastern mountains and Front Range mountains. Along with the potential for more snowfall, below-average temperatures accompany the extra moisture.
Snowfalls during recent El Niño years:
- 1982-1983: A “super” El Niño event dropped 81.6 inches of snow in Denver for the season
- 1997-1998: Another “super” event brought a 113% of average snowpack to the mountains
- 2015-2016: 72.8 inches of snow was recorded in Denver and the event produced high snowpack in the southern mountains
- 2023-2024: The most recent strong El Niño brought 131% of average snowpack to the state
“Statistically, northeast Colorado receives higher than average precipitation for the winter season during El Niño conditions as deep upslope conditions develop from organized storm systems which track into eastern Colorado and the central US plains from the Four Corners region,” the National Weather Service said in a 2018 outlook post.
Discover more from Rocky Mountain Journal
Subscribe to get the latest posts sent to your email.